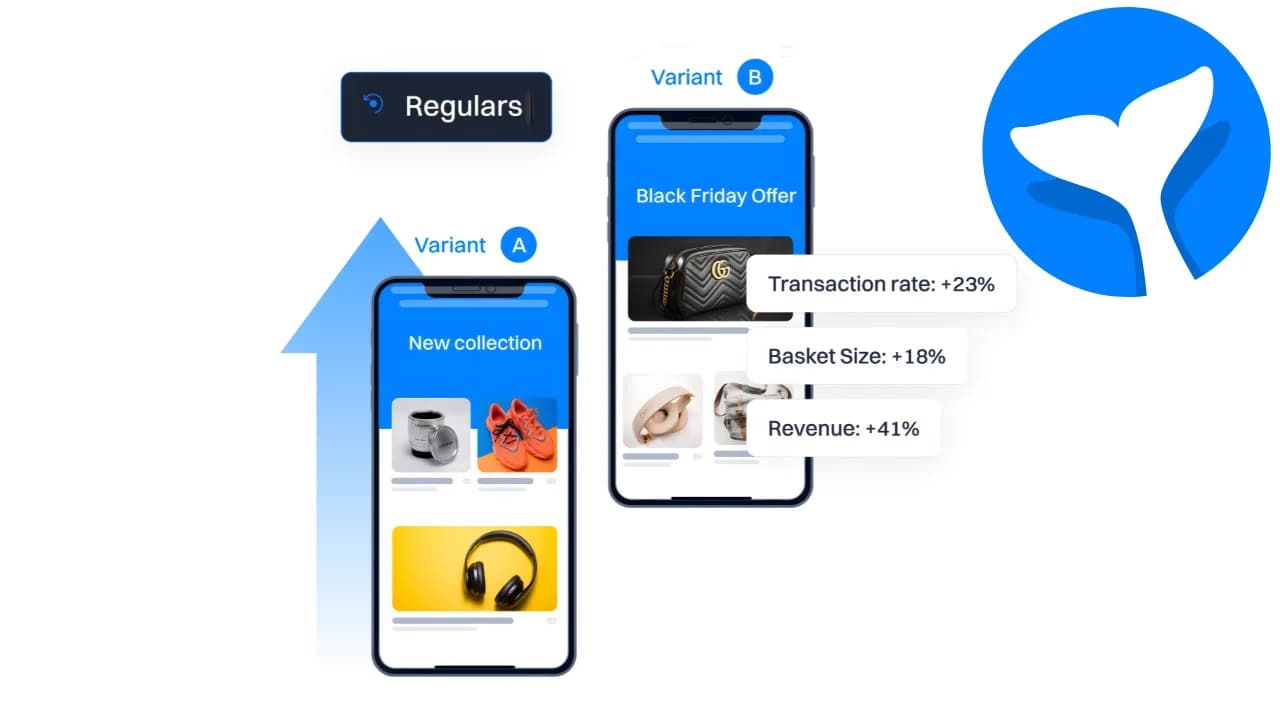
Test fast. Ship winners even faster.
Experiments share segments with your journeys. Winners ship as personalized experiences in one click.
HYPOTHESIS
Revamping the Product Detail Page to improve layout, visual hierarchy, and highlight key information will increase user engagement and drive higher conversion rates compared to the existing PDP design.
Mixed results with significant CVR gains
Video Ads Creative shows +43.4% lift in Conversion Rate (p < 0.001) with statistical significance. However, this comes with a -10.1% decrease in Visitors. Net revenue impact: +$12.4K/month if shipped.
Significant CVR lift (+43.4%) but visitor count declined by -10.1%
Net revenue impact estimated at +$12.4K/month if shipped
Statistical significance achieved (p < 0.001) on primary metric
Cumulative Users & Impressions
6,450
Cumulative Users
15,800
Total Impressions
One dashboard for your whole program
See every active experiment, its status, primary metric, and estimated revenue impact in one view. No spreadsheet needed.
Results you can trust at any time
MSPRT always-valid stats mean you can check results early without inflating false positives. CUPED gets you there 30–40% faster.
Winner to live in one click
Blu summarizes the result, flags guardrail violations, and ships the winning variant as a personalization rule. No engineering ticket.
See every test. Know what's winning.
- Program-level ROI dashboardAggregate revenue lift, experiments shipped, and win rate across the entire program. Not just the test you're running today.
- Active test monitoringEvery running experiment shows current sample size, primary metric trend, guardrail status, and estimated time to significance.
- Experiment history, searchableWinning and losing results stored with hypothesis, audience, and outcome. Learnings don't get lost between sprints.
Experimentation program showing strong ROI
Running 12 active experiments with 4 showing statistical significance. Shipped experiments contributed an estimated +$34K/month in incremental revenue.
$139,142.86
Total revenue
↑ 1.5% vs. previous period
$48,700.00
Intempt Attributed Revenue (35.00%)
↑ 0.9% vs. previous period
| Name | Status | Duration | Type | Created by | Last updated ↓ | |
|---|---|---|---|---|---|---|
Homepage Hero A/B Test 95% CICUPEDSequential TestingBenjamini-Hochberg | Active | 13 days | Experiment | SJSarah Johnson | Jun 11, 2025 |
Stats that work the way you actually test.
- MSPRT always-valid testingCheck results at any time without the peeking problem. No fixed sample size required upfront.
- CUPED variance reductionPre-experiment covariate adjustment reduces variance by 20–50%, reaching significance faster with the same traffic.
- Guardrail metrics, auto-flaggedDefine secondary guardrails alongside your primary goal. Violations are flagged before you ship, not after.
HYPOTHESIS
Revamping the Product Detail Page to improve layout, visual hierarchy, and highlight key information will increase user engagement and drive higher conversion rates compared to the existing PDP design.
Mixed results with significant CVR gains
Video Ads Creative shows +43.4% lift in Conversion Rate (p < 0.001) with statistical significance. However, this comes with a -10.1% decrease in Visitors. Net revenue impact: +$12.4K/month if shipped.
Significant CVR lift (+43.4%) but visitor count declined by -10.1%
Net revenue impact estimated at +$12.4K/month if shipped
Statistical significance achieved (p < 0.001) on primary metric
Cumulative Users & Impressions
6,450
Cumulative Users
15,800
Total Impressions
From winner to live personalization. Fast.
- Plain-language result summary from BluExplains what happened, why, and whether the result is reliable. In language your whole team can act on.
- One-click ship as personalizationShip the winner as a personalization rule targeting the same audience. No engineering ticket, no separate tool.
- Automatic holdout groupA holdout is maintained automatically so you can measure the true long-term lift of the shipped winner over time.
SETUP & STATUS
Ship Video Ads Creative
Significant lift on 5/7 metrics, including the primary metric: +9.8%. Shipping to 100% of traffic projects a +9.8% lift. Estimated ~2,100 additional purchases/month.
Significant lift on 5/7 metrics including the primary metric
Net revenue impact estimated at +$12.4K/month if shipped
Statistical significance achieved (p < 0.001) on primary metric
Primary Metrics
Ask Blu anything about your experiments
Blu reads live results, scores opportunities, flags guardrail violations, and recommends what to ship. In plain language.
From hypothesis to shipped winner, in days not weeks
Connect your sources
Server-side and client-side events land in the same unified profile. No separate instrumentation, use the events you already track.
SOURCES
JavaScript
Track events from web applications
Node JS
Server-side event tracking
iOS
Mobile analytics for iOS
Android
Mobile analytics for Android
Set metric, audience, and CUPED
Pick your primary metric, guardrails, target audience from shared segments, and CUPED covariate. One form. Launch the test.
Read the winner. Ship it in one click.
Results update live. When significance is reached, Blu summarizes, flags guardrails, and ships the winner as a personalization rule.
Plugs into your existing stack, no re-instrumentation
Use the events you already track. Client-side, server-side, or both.


%201.svg)

Experiment data, variant assignments, and results never leave your contracted data region.
No per-experiment fees. From $24/mo
MTU-based pricing. No traffic caps on Pro and above. One platform replaces 3–4 testing tools.
What teams stitch together today
- ✕A/B testing tool (Optimizely / VWO), per-experiment or MTU pricing
- ✕Separate CDP for audience targeting, manual segment sync
- ✕Engineering resource for shipping winners to production
- ✕Separate analytics tool to measure long-term lift
3–4 tools, stale audiences, slow ship cycle.
What Experiment gives you
- ✓A/B, multivariate, Champion / Challenger, server-side, and feature flag tests
- ✓Shared segments, same audiences as your journeys and personalization, no sync
- ✓MSPRT + CUPED, always-valid stats, 30–40% faster to significance
- ✓Guardrail metrics, auto-flagged before you ship a false winner
- ✓One-click ship as personalization, no engineering ticket
- ✓No per-experiment fees, no traffic caps on Pro+
What our customers have to say

“We were losing visitors before they signed up. Intempt's personalized experiences changed that - we started meeting people where they were instead of guessing. Once they're in, Intempt's automated email takes over and keeps the relationship moving. Acquisition and retention finally feel like one connected motion instead of two separate problems.”
Jim Stromberg, CEO
StockInvest
Case Study
StockInvest needed to turn anonymous traffic into registered users before any retention strategy could work. With Intempt's Experiences, they personalized the anonymous visitor flow, surfacing the right content and CTAs to boost signup conversion. Once users signed up, automated Journeys nurtured them through onboarding and deeper engagement, steadily increasing lifetime value.
Frequently asked questions
A/B tests, multivariate tests, multi-page experiments, Champion / Challenger tests, server-side experiments, and feature flag tests. You can test UI changes, copy, pricing, feature flags, and backend logic, all from the same platform.
Intempt uses MSPRT (mixture sequential probability ratio test) for always-valid testing. You can check results at any time without inflating false-positive rates. CUPED variance reduction helps you reach significance faster with the same traffic, typically reducing time to decision by 30–40%.
Yes. Experiment audiences use the same shared segments as your journeys and personalizations. No audience sync required. Targeting updates in real time as profile data changes.
When an experiment reaches significance, ship the winner as a personalization rule targeting the same audience in one click. No engineering ticket. No separate tool. Blu flags any guardrail violations before you confirm.
Experimentation tests whether a change improves a metric. Personalization applies the winning change to specific audiences permanently. In Intempt, the two are connected: you ship an experiment winner directly as a personalization rule in one click.
No. Client-side experiments use the Intempt visual editor. Server-side experiments use the Intempt SDK. Most teams launch their first experiment within a day of setup without a dedicated engineering sprint.
Yes. Intempt handles mutual exclusion and collision detection automatically. You can also group experiments into a program and define priority order across overlapping tests.
MSPRT always-valid statistics let you check results at any time without the peeking problem that inflates false-positive rates in frequentist tests. You don't need to commit to a fixed sample size or wait until a predetermined end date.
Any event tracked in Intempt can be a primary or guardrail metric. Common primary metrics include conversion rate, revenue per user, and feature adoption. Common guardrails include bounce rate, support ticket volume, and page performance.
All experiment data, variant assignments, and results are encrypted at rest and in transit. Intempt is SOC 2 Type II certified and GDPR compliant. No experiment data leaves your contracted data region.
Certified & Compliant


Stop debating winners. Start shipping them.
Connect your sources in minutes. Run your first always-valid experiment and ship the winner by tomorrow.