Finding the best analytics tools for website user behavior feels straightforward until you open three dashboards and realize none of them tell you what you actually need to know. You can see traffic.
You can see bounce rates. What you cannot see is the specific moment 68% of your visitors decided to leave.
That gap is expensive. Research from the Baymard Institute puts the average cart abandonment rate at 70.19%, and most of it comes down to friction points that show up clearly in behavioral data but never surface in standard traffic reports.
User behavior tracking, session recordings, heatmap analysis, funnel drop-offs, and product analytics are the tools that expose those moments before they compound into churn or lost revenue.
The tools in this guide each tackle a different piece of that problem. Some are built for watching real user sessions. Some are built for cohort analysis and product analytics across millions of events.
Some connect website visitor behavior insights directly to activation. The right pick depends on which question your team is actually trying to answer first.
What Are Analytics Tools For Website User Behavior?
Analytics tools for website user behavior are the tools that track how real users interact with your site or product. Clicks, scroll depth, funnel drop-offs, feature usage, session paths, and how behavior changes over time. The goal is to move past "how many people visited" and get to "what did they actually do when they got here."
The category breaks into a few distinct types. Session replay tools like Fullstory and Hotjar record real user sessions so you can watch what happened on a specific page.
Event-based analytics platforms like Mixpanel and Amplitude let you define user actions, build funnels, and slice behavior into cohorts.
All-in-one platforms like Intempt combine behavior tracking with activation capabilities, so you can segment users and run personalized experiments from the same place.
Standard web analytics tells you acquisition and traffic volume. Behavior analytics tells you what users did after they arrived. Both matter. They answer different questions, and most serious teams end up using both.
Why Do You Need Website User Behavior Analytics?
According to Contentsquare's 2025 Digital Experience Benchmark, the average website bounce rate sits at 50.9%, and most visitors view fewer than three pages per session. If you don't know what's driving that, you cannot fix it. Guesswork-driven A/B tests fail more often than tests built on behavioral evidence.
The cost of not knowing shows up in the funnel. Onboarding flows that look fine in wireframes lose 40% of trial users in practice. UX changes shipped without session data fix the wrong problems.
Feature launches built on assumptions about user behavior routinely underperform because the team didn't know which behaviors actually predict conversion.
The competitive edge goes to teams that connect specific behaviors to specific revenue outcomes. Not "users visited the pricing page" but "users who clicked the comparison table on the pricing page converted at 3x the rate of those who scrolled past it."
That precision requires the right tool pointed at the right data.
What to Look For in a Website User Behavior Analytics Tool?
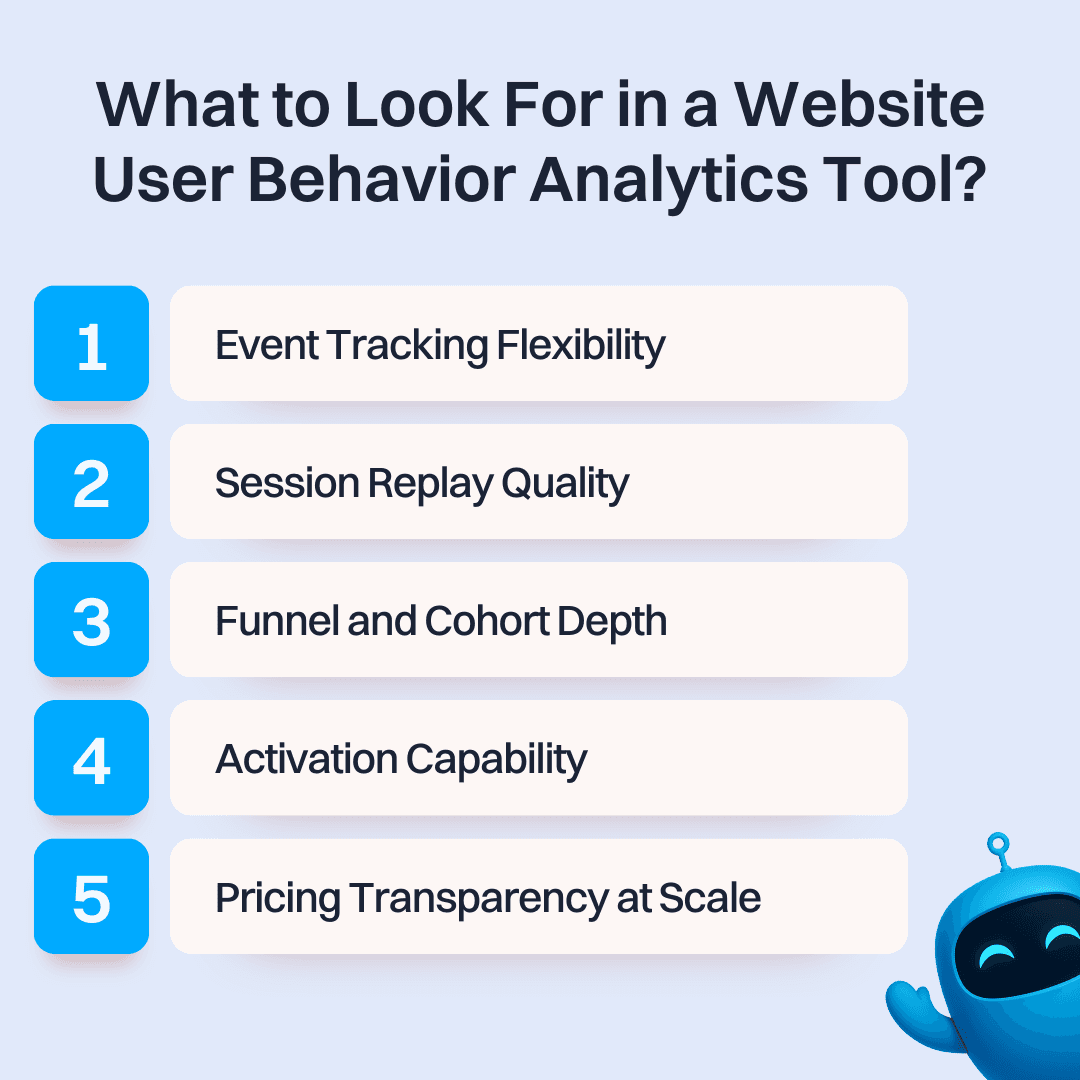
1. Event Tracking Flexibility
Some tools autocapture everything from day one, like Heap and Fullstory. Others require you to define events manually, like Mixpanel and Amplitude. Neither approach is wrong. Autocapture gets you started immediately and lets you run retroactive analyses. Manual tracking gives you cleaner, more intentional data. Know which fits your team's technical capacity before choosing.
2. Session Replay Quality
If watching real user sessions is part of your workflow, look for tools that record at high fidelity without degrading page performance. Check data retention periods: some tools keep recordings for only 30 days, which limits long-term pattern analysis. Pixelated replays or sessions with missing interactions make the feature nearly useless.
3. Funnel and Cohort Depth
The ability to define multi-step funnels and compare behavioral cohorts over time is what separates real analytics platforms from basic tracking dashboards. Look for customizable conversion goals, time-to-convert metrics, and the ability to analyze how different cohorts retain or churn differently.
4. Activation Capability
Behavior data with no way to act on it is expensive reporting. The best tools either include activation natively (in-app messages, email journeys, personalization experiments) or integrate cleanly with the tools you already use. If every insight requires an export to a separate platform before anything happens, you've added friction, not solved it.
5. Pricing Transparency at Your Actual Scale
Many tools in this category scale aggressively in cost with event volume, session counts, or monthly active users. A plan that costs $49/month for a 10,000-user product can easily reach $2,000/month as you grow. Always model the cost at your real traffic volume before committing.
The Top Picks
Comparison Table
| Tool | Best For | Starting Price | Key Strength |
|---|---|---|---|
| Intempt | SaaS and e-commerce teams wanting behavior analytics, CDP, and activation in one platform | Free; $19/seat/mo (Professional) | CDP + analytics + personalized experiments with no event or seat caps |
| Fullstory | Enterprise product and engineering teams that need pixel-perfect session replay | Free (30K sessions/mo), from $199/mo (Business) | Highest-fidelity session replay with AI-assisted insight surfacing |
| Mixpanel | Product and growth teams focused on event-based funnel and cohort analysis | Free (1M events/mo), from ~$24/mo (Growth) | Real-time event analytics with flexible no-code dashboards |
| Amplitude | Product teams at growth-stage SaaS companies tracking feature adoption and retention | Free (1K MTUs), from $49/mo (Plus) | Deep funnel, retention, and journey analytics with predictive modeling |
| Pendo | Mid-market SaaS teams needing product analytics + in-app guidance | Free up to 500 MAU; from ~$15,900/yr | Behavioral analytics paired with in-app guides and NPS |
| Google Analytics (GA4) | Any team needing free traffic and acquisition tracking with Google Ads integration | Free (standard), $50,000/year (GA360) | Completely free; native integration with Google Ads and Search Console |
| Contentsquare | Enterprise and mid-market teams needing heatmaps, session replay, and journey analysis | Free up to 200K sessions/mo; from $49/mo | Zone-based heatmaps tied to revenue impact + auto event tracking via Heap |
1. Intempt for Website User Behavior Analytics
Intempt is a unified growth platform that tracks website user behavior in real time, combining event analytics, behavioral segmentation, and journey mapping into one solution, starting free and scaling from $19/seat/month for growing teams.
It's built for SaaS and e-commerce teams that want to go beyond pageview counts and understand exactly how users move through their site, where they drop off, and which behaviors predict conversion, without stitching together a separate analytics tool, CDP, and activation platform.
The Organization plan adds advanced journey automation and team collaboration features, which makes it particularly strong for teams that want to act on behavioral insights directly, without an extra integration step.
What You Get
- Real-Time Behavioral Tracking: [Captures every user action across your website and app, including clicks, page visits, scroll depth, and feature usage, and updates segments and dashboards instantly as behavior happens.
- Funnel and Drop-Off Analysis: Tracks multi-step conversion funnels and shows exactly where users abandon, with the ability to slice drop-off data by cohort, acquisition source, device, or any custom attribute.
- User Journey Mapping: Visualizes the full paths users take across your site from first visit to conversion or churn, surfacing the most common routes and the unexpected detours that lose people along the way.
- Behavioral Segmentation: Automatically builds and updates audience segments based on live user behavior, so you're always working with segments that reflect what users are doing right now, not a static snapshot from last week.
- Personalized Experiments: Runs A/B tests and personalization campaigns tied directly to behavioral segments, so every test is run on the exact users whose behavior identified the problem in the first place.
- Revenue Attribution: Native Shopify and Stripe integrations connect behavioral events to actual purchase outcomes, showing which user journeys drive revenue, not just engagement.
- CDP with Identity Resolution: Stitches together behavior across devices, sessions, and channels into a single user profile, so your behavioral data is always attached to a person, not a browser.
Who Should Use It
Intempt is the right fit for SaaS teams between $500K and $20M ARR and e-commerce stores that want a clear picture of how users behave on their site and the tools to act on it without switching platforms.
Particularly strong for teams where the same people who analyze behavior are also responsible for running experiments and lifecycle campaigns, and who can't afford to have those workflows living in separate tools.
Teams that need to connect website behavior directly to revenue outcomes, rather than stopping at clicks and sessions, will get the most out of Intempt's funnel analytics, journey mapping, and built-in activation layer.
What to Watch For
Intempt is not primarily a session replay tool. If your team's core workflow is watching individual user recordings to find UX bugs, you'll want to pair it with a dedicated tool for that job. Getting the most out of predictive segmentation and server-side experiments also requires thoughtful event setup at the start. The payoff is real, but the initial data mapping takes time to do right.
Pricing
Free: $0/month, includes up to 1,000 MAU and limited features, no credit card required. Professional: $19/seat/month (annual) or $24/seat/month (monthly), full access to all 15 products. Organization: $39/seat/month (annual). Enterprise: $79/seat/month (annual) with SSO, dedicated support, and custom integrations. View full pricing.
2. Fullstory
Fullstory is a digital experience intelligence platform that combines pixel-perfect session replay, behavioral analytics, and AI-assisted insight surfacing in one product. It's built for product, UX, and engineering teams at mid-market and enterprise companies that need to diagnose user friction at a level of detail most tools cannot match.
Fullstory's defining capability is its data model. It captures every user interaction automatically and stores it in a structured, queryable format, so you can retroactively ask questions about data you didn't plan to track.
What You Get
- High-Fidelity Session Replay: Records every user session at the pixel level, including DOM captures, network requests, and console errors, giving engineering teams everything needed to reproduce a bug.
- Autocapture: Records all user interactions automatically without event tagging, so no behavior is missed before you know to look for it.
- Frustration Signals: Automatically surfaces rage clicks, dead clicks, and erratic mouse movements to flag broken or confusing UI elements without manual review.
- StoryAI Session Summaries: AI layer that writes plain-language summaries of what happened in a session, reducing the time spent watching hours of recordings manually.
- Funnels and Journey Analysis: Visualizes conversion funnels and user paths with the ability to drill from an aggregate drop-off view directly into the specific sessions where it happened.
- Data Export and Integrations: Connects to your data warehouse, CRM, and support tools so session context informs other teams.
- Retroactive Analysis: Because all data is stored by default, you can run new analyses on historical user behavior without setting up tracking in advance.
Who Should Use It
Fullstory is best suited for product and engineering teams at companies with 50+ employees where session replay and experience debugging are core daily workflows.
Particularly strong for SaaS products with complex user flows where a UX friction point directly impacts trial-to-paid conversion rates. Teams that need product, design, and engineering aligned on what users actually experience will get significant value from Fullstory's collaborative session review.
What to Watch For
Fullstory gets expensive quickly. Based on user-reported data compiled by G2 and Vendr, annual contracts commonly run from $10,000 to over $100,000 depending on session volume and negotiated terms. The free plan caps at 30,000 sessions per month, which disappears fast for any active product. Business and Advanced plans require annual commitments, so you are locked in before you fully validate the tool for your use case.
Pricing
Free: $0/month, includes 30,000 monthly sessions, 12 months of analytics retention, session replay, and up to 10 users. Business: from $199/month (annual billing). Advanced: from $499/month (annual billing), adds StoryAI and full intelligence layer. Enterprise: custom.
3. Mixpanel

Mixpanel is an event-based product analytics platform built for tracking user behavior, measuring feature adoption, and running funnel analysis with real-time data. It's one of the most widely used tools among product and growth teams that need to understand the "why" behind user actions without waiting on data engineering to pull a report.
Mixpanel's strength is speed and reporting flexibility. Query real-time data, slice it by any property, and share dashboards across teams, no SQL required.
What You Get
- Event-Based Funnel Analysis: Defines multi-step conversion funnels and shows exactly where users drop off, with the ability to segment results by user property, device, geography, or any custom attribute.
- Cohort Analysis: Groups users by shared behaviors (like "signed up in January and used feature X within 7 days") and tracks how their retention and conversion rates differ over time.
- Real-Time Reporting: Data updates as it comes in, so teams can measure the impact of a product change or campaign within minutes of launch.
- No-Code Dashboards: Non-technical teammates can build and share reports without SQL, reducing the dependence on data analysts for standard queries.
- Session Replay (Add-On): Available as an add-on, allowing teams to jump from an aggregate funnel drop-off view directly into individual user session recordings.
- Flows and Retention Reports: Visualizes the paths users take through your product and tracks how retention curves change across cohorts and release cycles.
- Integrations: Connects to HubSpot, Segment, Salesforce, and major data warehouses for bidirectional data flow.
Who Should Use It
Mixpanel is the right fit for product and growth teams at SaaS companies between $1M and $50M ARR that need fast, flexible event analytics without a dedicated data team. Particularly strong for teams running frequent product experiments and short release cycles where seeing results in real time matters. If your primary job is answering "did this change work?" quickly, Mixpanel handles that better than most platforms in this list.
What to Watch For
Event-based pricing is the main watch-out. As your product tracks more events (which is usually what you want), the bill grows with it. Mixpanel's Growth plan ranges from approximately $24/month for small event volumes to $2,289/month at 20 million events/month, with anything above that requiring an enterprise contract. Teams with high-traffic products need to model costs at their real scale. Mixpanel also does not include built-in activation features, so every insight requires a hand-off to another tool before anything happens.
Pricing
Free: $0/month, includes 1 million events/month. Growth: starts at approximately $24/month for smaller event volumes, scales to $2,289/month at 20M events/month, with a 30% discount for annual billing. Enterprise: custom pricing.
4. Amplitude

Amplitude is a product analytics platform built for tracking the full customer journey from first touch through activation, feature adoption, and long-term retention. It's designed for product teams that need analytical depth: detailed funnels, behavioral cohorts, multi-touch attribution, and predictive models that flag churn risk before it shows up in your MRR.
Amplitude goes further than most analytics tools on the question of why users behave the way they do. It's what teams reach for when "our retention is dropping" needs to become "users who don't activate feature X within 14 days churn at 3x the rate of those who do."
What You Get
- Funnel and Retention Analysis: Tracks conversion funnels step by step and shows retention curves broken down by user cohort, signup date, acquisition source, or any property you define.
- Behavioral Cohorts: Builds audiences based on actions users have or haven't taken, then compares their behavior and revenue contribution over any time window.
- Journey Analysis: Maps the paths users take through your product before converting or churning, surfacing the most common routes and the unexpected detours.
- Predictive Cohorts: Uses machine learning to identify users likely to convert, churn, or engage with a specific feature before the behavior occurs.
- Experiment Analysis: Integrates with A/B testing tools to measure experiment results against behavioral data and retention outcomes, not just binary conversion rates.
- Audiences and Activation: Syncs behavioral cohorts to ad platforms, email tools, and CRMs for targeted downstream activation.
- Shared Dashboards: Builds charts for events, funnels, retention, revenue, and user paths all in one view, shareable across product, marketing, and leadership.
Who Should Use It
Amplitude is best for product-led SaaS companies between $5M and $200M ARR with a dedicated product or analytics team. It's particularly powerful for products with complex multi-step activation flows where understanding the exact path to value is a repeating strategic priority.
Teams running a high volume of product experiments and needing rigorous statistical analysis of results will get more out of Amplitude than simpler tools in this list.
What to Watch For
Amplitude's depth is also its liability for smaller teams. Poorly defined event taxonomies produce confusing dashboards that nobody trusts, and fixing the underlying data structure is painful after the fact. Amplitude's paid plans start at $49/month for the Plus tier, but Growth and Enterprise plans are custom-priced and commonly run from $5,000 to $70,000+ annually depending on monthly tracked users and features. Without someone who owns the analytics setup, the tool will consistently underperform its potential.
Pricing
Starter: $0/month, includes up to 1,000 monthly tracked users (MTUs) and 12 months of data retention. Plus: from $49/month (annual billing), scales with MTU volume. Growth and Enterprise: custom pricing, typically $5,000 to $70,000+/year.
5. Pendo
Pendo is a product analytics and digital adoption platform that tracks in-app user behavior through event analytics, heatmaps, and session replay while also letting teams build onboarding guides and collect NPS feedback from the same tool. It's built for mid-market SaaS product teams that need behavioral data and the ability to act on it directly inside the product, without involving engineering for every change.
What You Get
- Product Analytics: Tracks feature usage, clicks, page visits, and user flows to show which parts of your product users actually engage with and which get ignored.
- In-App Guides: Builds onboarding tours, tooltips, and feature announcements directly inside your product, targeting specific behavioral segments without code changes.
- Heatmaps: Visualizes engagement patterns across pages and surfaces which elements drive interaction and which create confusion. Available on all plans.
- Session Replay: Records full user sessions including cursor movement, scrolling, and clicks. Available as an add-on on Base, included from Core upward.
- NPS and Sentiment Surveys: Collects in-app feedback tied to behavioral context so product teams can connect user sentiment to actual usage patterns.
- Frustration-Based Segmentation: Automatically identifies users experiencing rage clicks, dead clicks, and U-turns, so friction points surface without manual analysis.
- Journey Orchestration: Maps multi-step engagement workflows across your product to guide users toward key actions. Available on Core and Ultimate plans.
Who Should Use It
Pendo is the right fit for mid-market SaaS companies with 50 to 5,000 employees where product, customer success, and UX teams share the same behavioral data and need both analytics and in-app intervention from one platform.
Particularly strong for teams running complex onboarding flows where behavioral tracking and in-app messaging need to work together without separate tool integrations.
What to Watch For
Pricing jumps sharply past the 500 MAU free tier, with paid plans starting around $15,900/year and scaling well past $100,000/year at enterprise volumes, making it a tough sell for early-stage teams. Session replay isn't included in the base plan by default, so the entry price doesn't reflect what most teams actually need. Users on G2 also flag data inaccuracies when syncing to external CRMs and dashboards that can feel slow to navigate.
Pricing
Free: $0/year, up to 500 MAU, includes product analytics, heatmaps, in-app guides, and Pendo-branded NPS. Base: from approximately $15,900/year with session replay as a paid add-on. Core: from approximately $25,000/year, includes session replay and journey orchestration. Ultimate: from approximately $100,000/year, adds real-time data warehouse sync and AI feedback querying. All paid plans require annual contracts.
6. Google Analytics (GA4)
Google Analytics 4 is Google's free web analytics platform that tracks traffic, acquisition, user behavior, and conversion events across websites and apps. It's the default starting point for most teams because it costs nothing and integrates natively with Google Ads, Search Console, and the rest of the Google ecosystem.
GA4's event-based architecture replaced the session-and-pageview model of Universal Analytics with a more flexible structure. That's both its strength and its steepest learning curve.
What You Get
- Traffic and Acquisition Reporting: Tracks where users come from across organic search, paid ads, social, email, and direct channels, with multi-touch attribution modeling.
- Event-Based Tracking: Measures any user interaction as a named event, including page views, button clicks, video plays, form submissions, and custom actions.
- Funnel Exploration: Builds conversion funnels in the Explorations feature to identify where users drop off across multi-step journeys.
- Audience Builder: Creates segments based on behavior, demographics, device, geography, and engagement level, with one-click export to Google Ads for targeting.
- BigQuery Export: Free raw data export to BigQuery allows analysts to query unsampled GA4 data, which resolves the sampling limitations of the standard reporting interface.
- Cross-Device Tracking: Stitches together web and app behavior using Google's identity graph to build a more complete view of the user journey.
- Google Ads Integration: Connects GA4 conversion events directly to Google Ads tracking and audience targeting without additional configuration.
Who Should Use It
GA4 is a good to have for any team running Google Ads, as the native integration alone justifies the setup. It's also the right choice for teams that need traffic and acquisition reporting at scale with zero budget.
Content sites, lead generation businesses, and e-commerce stores relying on organic and paid search will get the most from GA4's ecosystem integrations.
What to Watch For
GA4 is not a product analytics platform in the same sense as Amplitude or Mixpanel. Cohort analysis, user-level journey mapping, and behavioral segmentation are significantly more limited. Data sampling in the standard interface can skew reports for high-traffic sites, and the BigQuery workaround requires engineering resources. The Explorations feature is powerful but notoriously non-intuitive. GA360 starts at $50,000/year and is overkill for the vast majority of teams outside the enterprise segment.
Pricing
GA4 standard: free, includes up to 10 million events/month with standard reporting. GA4 360 (enterprise): starts at $50,000/year with 25 million events/month included, scaling beyond that on a usage basis.
7. Contentsquare
Contentsquare is a digital experience analytics platform that combines session replay, zone-based heatmaps, journey analysis, and product analytics into one suite, with Heap's automatic event tracking now built in following its 2023 acquisition. It's built for mid-market and enterprise teams running high-traffic websites that need to connect user behavior to revenue impact, not just traffic metrics.
What You Get
- Zone-Based Heatmaps: Shows which specific page elements drive conversions and revenue, not just where users click, so teams can prioritize UX fixes by business impact rather than engagement counts.
- Session Replay with AI Summaries: Records full user sessions and uses AI to automatically distill each session into a concise overview of what happened, so teams spend less time watching recordings.
- Automatic Event Tracking (via Heap): Captures every user interaction on your site without manual instrumentation, eliminating the need for engineering resources every time you want to track a new behavior.
- Journey Analysis: Maps the paths users take across your site from entry to conversion or exit, identifying loops and drop-off points that signal friction in the experience.
- Error Analysis: Surfaces JavaScript, API, and user-defined errors ranked by their impact on conversions and revenue, with real-time alerts and session replay linked directly to each error.
- Frustration Detection: Identifies rage clicks, dead clicks, and hesitation patterns across pages and connects them to specific journey stages where user frustration is highest.
- Voice of Customer: Collects in-session surveys and runs user interviews to pair quantitative behavioral data with direct user feedback.
Who Should Use It
Contentsquare is the right fit for enterprise and mid-market e-commerce and digital teams with high session volumes that need session replay, heatmaps, and product analytics without managing separate tools for each.
Particularly strong for teams where UX, product, and analytics functions all need access to behavioral data and where connecting page-level behavior to revenue outcomes is a core workflow.
What to Watch For
Setup is complex and time-consuming, and getting full value from the platform requires significant upfront configuration of page groups and mappings. The error detection module is an optional add-on, not included in base plans, so the starting price understates what most teams will actually spend. Users also report rigid filtering, limited raw data export, and dashboards that can't easily combine insights across modules.
Pricing
Experience Analytics: Free up to 200,000 sessions/month with session replays, heatmaps, and funnels included. Growth: from $49/month scaling with session volume. Pro and Enterprise: custom pricing for 1M+ sessions, 115+ integrations, and advanced capabilities. Product Analytics (Heap): Free up to 10,000 sessions/month; paid plans custom-priced. Error detection is an add-on across all tiers. Annual enterprise contracts commonly land in the tens of thousands of dollars.
How to Choose?
| Tool | When to Choose | Best For | Not Ideal If |
|---|---|---|---|
| Intempt | When you run a SaaS or e-commerce business and want behavioral analytics, segmentation, and lifecycle activation from one platform without managing separate CDP, analytics, and email tools. | Teams where the same people both analyze behavior and take action. Pricing starts free and scales from $19/seat/month. | If your main workflow is watching individual session recordings. |
| Fullstory | When your key question is "what exactly did this user do?" and you need searchable, high-fidelity session replay tied to behavioral data. | Product and UX teams in companies with 50 to 500 employees who need to reproduce bugs and validate design decisions from real sessions. | If you handle very high session volumes on a tight budget, since costs can scale quickly. |
| Mixpanel | When product teams need self-serve event analysis, flexible funnels, and cohort reporting without involving a data analyst for each query. | SaaS product teams with $1M to $30M ARR that already have a clean event taxonomy or can invest in building one. | If your team cannot properly instrument events upfront. |
| Amplitude | When you want behavioral analytics and A/B experimentation within the same platform and growth + product teams collaborate on feature impact. | SaaS companies with $5M to $100M ARR and a dedicated product analytics function. | If you also need built-in marketing activation or lifecycle automation. |
| Pendo | When you want product analytics plus in-app user guidance like onboarding flows, feature announcements, or NPS surveys without engineering work. | Mid-market SaaS companies with 50 to 5,000 employees where product and customer success share behavioral data. | Early-stage or bootstrapped teams, since paid plans start around $15,900/year. |
| Google Analytics 4 | When you need free website traffic and conversion tracking and want insight into acquisition channels and campaign performance. | Any team needing a reliable analytics baseline without spending budget. | If you require deep session-level behavior analysis or advanced user journey mapping. |
| Contentsquare | When you run a high-traffic website and want heatmaps, session replay, journey analysis, and automatic event tracking from one enterprise platform. | Mid-market and enterprise e-commerce or digital teams with 200+ employees across UX, product, and analytics. | Startups or small teams due to complex setup and enterprise pricing. |
Bottom Line
Most teams don't have a data problem. They have an action problem. They can see that users are dropping off, but they can't connect that drop-off to a specific behavior, a specific page element, or a specific segment fast enough to do anything about it.
The best analytics tools for website user behavior close that gap, and the right one depends entirely on where your team gets stuck most often.
For most SaaS and e-commerce teams that want a single platform to track behavior, build segments, and activate campaigns without managing a disconnected stack, Intempt is the strongest starting point. Fullstory wins on session replay depth.
Mixpanel and Amplitude are the standard for self-serve product analytics, with Amplitude pulling ahead when experimentation is part of the workflow. Pendo earns its price if your team needs in-app guidance and NPS alongside behavioral data. Contentsquare is the enterprise choice when zone-level revenue impact and automatic event tracking matter more than cost.
GA4 is the free baseline every team should have running regardless of what else they use.
Pick one tool that solves your most pressing question right now. Don't build a five-tool stack before you've answered the first question. Start with the free tier, instrument your most important funnel, and let the data tell you what to add next.
TL;DR
- Intempt is the best all-in-one pick for SaaS and e-commerce teams that want behavioral analytics, segmentation, and lifecycle activation from one platform, starting free and scaling from $19/seat/month.
- Fullstory is the strongest choice for session replay depth, with searchable behavioral data that makes it easy to reproduce bugs and validate UX decisions.
- Mixpanel is best for product teams that need flexible self-serve event analytics and funnel reporting without SQL, as long as event tracking is set up cleanly.
- Amplitude edges ahead of Mixpanel when your team runs A/B experiments alongside behavioral analysis and needs both in one place.
- Pendo is worth the price for mid-market SaaS teams that need product analytics, in-app guides, and NPS running together, but the cost is hard to justify below $15,900/year.
- Google Analytics 4 is the free baseline every team should have regardless of what else they use, strong on acquisition and campaign data, limited on behavioral depth.
- Contentsquare is the enterprise pick for high-traffic websites that need zone-based heatmaps tied to revenue, session replay, and automatic event tracking from one platform.
Frequently asked questions. Answered.
The best tool depends on what you need to do with the data. For all-in-one behavior analytics with built-in activation, Intempt is the clearest pick. For pure session replay depth, Fullstory. For event-based product analytics, Amplitude or Mixpanel. For fast visual heatmaps on a small budget, Hotjar is hard to beat.
Web analytics (like GA4) tells you how many users visited, where they came from, and which pages they viewed. User behavior analytics tells you what they did on those pages, where they clicked, how far they scrolled, and where they dropped out of a funnel. Both answer different questions, and most teams need both running simultaneously.
Not always. Tools like Intempt offer no-code setup that a marketer can handle with a single script tag. Amplitude and Mixpanel require more deliberate event planning, which typically involves engineering time. The more control and precision you want over your data, the more technical work is involved upfront.
No, not for most teams. GA4 covers acquisition and high-level page behavior well, but it does not replace funnel depth, cohort analysis, session replay, or feature adoption tracking. Most product and growth teams use GA4 alongside a dedicated behavior analytics tool rather than instead of one.
Yes. Intempt combines behavioral analytics, CDP, email and SMS marketing, journey automation, and personalized experiments in one platform. Teams using separate subscriptions for each of those functions often find that Intempt covers the full workflow from a single plan, which is why it replaces 8+ tools for some teams and saves over $2,000/month in combined stack costs.
Look for tools that offer built-in consent management, data subject request handling (the ability to delete a specific user's data on request), data residency options, and documented data retention policies. For any tool you evaluate, review their Data Processing Agreement before onboarding users in the EU. This is non-negotiable regardless of which platform you choose.

About the author
Hardik Sharma
Growth Marketer
Hardik researches and writes about marketing tools, sales technology, and customer engagement platforms. His work helps teams evaluate software with honest feature and pricing breakdowns.
LinkedIn