Find out which traffic source drives revenue.
Connect every channel, campaign, and session to the actual revenue it produced. LTV by acquisition source so you know which spend is worth it.

“We were losing visitors before they signed up. Intempt's personalized experiences changed that - we started meeting people where they were instead of guessing. Once they're in, Intempt's automated email takes over and keeps the relationship moving. Acquisition and retention finally feel like one connected motion instead of two separate problems.”

Jim Stromberg
CEO, StockInvest
The goal is revenue, not traffic volume.
- Full-funnel revenue analytics connecting traffic source to first purchase and LTVUTM-level attribution so every campaign and ad set links to actual revenue, not just clicks. No more guessing which sessions turned into dollars.
- UTM-level attribution so every campaign and ad set links to actual revenueGoogle Analytics tells you sessions. Stripe tells you revenue. Neither tells you which sessions became the revenue. Intempt connects both.
- Blu flags what is not working with specific numbersYou spent $12K on Facebook ads this month. It produced $3,200 in revenue. Here is where it leaked and where to move the budget.
Facebook drove 29% of sessions but only 3.2% of revenue
You spent $12K on Facebook ads this month. It produced $3,200 in revenue. LinkedIn spent $4K and returned $28,400. Reallocate the difference.
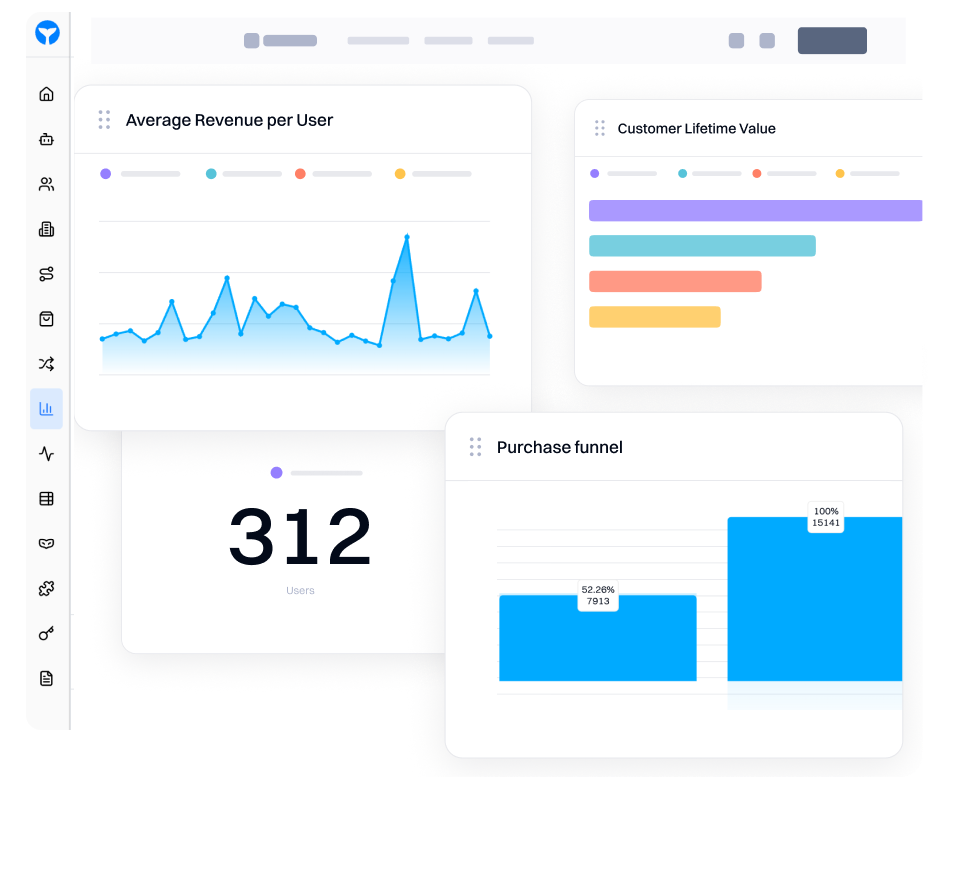
Sessions
48,291
Sign-ups
3,214
Trials
1,847
Revenue
$100K
| Source | Sessions | Sign-ups | CVR | Revenue |
|---|---|---|---|---|
| Organic Search | 18,241 | 1,204 | 6.6% | $41,200 |
| LinkedIn Ads | 6,812 | 612 | 9.0% | $28,400 |
| Facebook Ads | 14,390 | 480 | 3.3% | $3,200 |
| Direct | 5,418 | 618 | 11.4% | $18,100 |
| Paid Search | 3,430 | 300 | 8.7% | $9,100 |
Know your highest-LTV acquisition channels.
- LTV and conversion rate by acquisition channel, updated continuouslyPayback period and CAC calculated per source to inform your pricing strategy and channel budget. The cheapest click is often the most expensive customer.
- Payback period and CAC calculated per source to inform your channel budgetA channel that drives cheap signups is not necessarily the channel that drives customers who stay and expand. See the full picture.
- Blu recommends specific budget shifts backed by LTV dataPause TikTok. Increase LinkedIn by $3K per month. Based on 90-day LTV, LinkedIn returns $4.20 per dollar versus $0.80 for TikTok.
LinkedIn returns $4.20 per dollar. TikTok returns $0.80.
Pause TikTok and increase LinkedIn by $3K per month. Based on 90-day LTV, this shift adds an estimated $8,200 in net revenue.
Blu shows you which channels are worth it.
- Multi-touch attribution across the full customer journey from first click to renewalChannel comparison identifying high-performing sources by revenue contribution, not just session volume or form fills.
- Channel comparison by revenue contribution, not just session volumeMost teams build attribution dashboards and make the same budget decisions. Blu tells you specifically where to reallocate.
- Blu recommends where to reallocate budget with the revenue analysis behind itIncrease spend on LinkedIn. Pause TikTok. Here is the revenue analysis that backs up that recommendation with real LTV and payback data.
Reallocating $5K/mo adds an estimated $21K in 90-day revenue
Pause TikTok and Facebook. Move budget to LinkedIn. Based on multi-touch attribution across your last 90 days of revenue data.
Raise by $3K/mo. Returns $4.20 per dollar at 90-day LTV. Highest paying customers come from this source.
Steady $8.88 ROI. Content engine is compounding. No budget change needed this quarter.
Returns $0.80 per dollar. 190-day payback period. Reallocate $2K/mo to LinkedIn immediately.
$1.23 ROI and 152-day payback. Cut budget by 40% and redirect to LinkedIn or Paid Search.
Built for the outcomes that matter.
Related analytics use cases on Intempt.
Connect every trusted source.
Plug into the tools your team already runs on.
Your customer data stays yours, and stays secure.
FAQ
Frequently asked questions
Everything you need to know about traffic and revenue analytics.
Revenue analytics enables organizations to connect their traffic, marketing, and behavioral data to actual revenue outcomes so they can understand which sources and campaigns drive the most valuable customers. Intempt links every session, UTM parameter, and traffic source to the purchases and subscriptions they produced.
The best revenue analytics tool for connecting traffic sources to revenue tracks the full customer journey from first click through payment, not just the last touchpoint. Intempt connects every traffic source, UTM parameter, and session to actual revenue events using multi-touch attribution.
Tools that analyze traffic measure sessions, pageviews, and bounce rates. Revenue analytics connects those sessions to actual purchases, subscriptions, and customer lifetime value. Knowing that LinkedIn drove 200 sessions is useful. Knowing those sessions produced $18K in first-year revenue is what informs budget decisions.
Intempt tracks every touchpoint a customer interacts with from their first anonymous session through their first purchase and beyond. Multi-touch attribution distributes revenue credit across those touchpoints using linear, first-touch, last-touch, or time-decay models.
Yes. Intempt connects to Google Ads, Facebook Ads, LinkedIn Ads, and your billing system simultaneously. You can see cost per acquisition, payback period, and 90-day LTV by campaign and ad set.
Google Analytics shows sessions, bounce rates, and last-click conversions. It does not connect to subscription billing, does not calculate LTV by channel, and does not track the full multi-touch journey. Intempt connects every traffic event to actual revenue and customer lifetime value.
Know which traffic source drives revenue, not just sessions.
Connect your traffic sources and billing system. Intempt links every session to actual revenue and tells you which channels produce customers who stay.