The AI reporting tool that explains itself.
Build any funnel or retention report in seconds. Click any drop-off bar and land on the actual users behind it. Blu explains the pattern.

“We were losing visitors before they signed up. Intempt's personalized experiences changed that - we started meeting people where they were instead of guessing. Once they're in, Intempt's automated email takes over and keeps the relationship moving. Acquisition and retention finally feel like one connected motion instead of two separate problems.”

Jim Stromberg
CEO, StockInvest
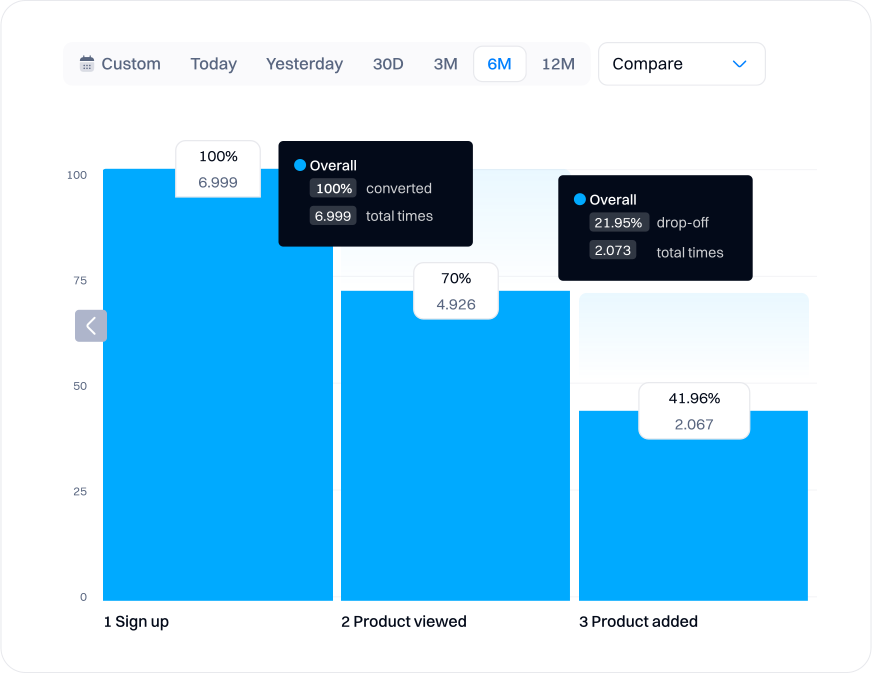
See the exact step where users drop off.
- Step-by-step funnel conversion rates with time-to-convert at each stageClick any drop-off bar and land on the exact users who abandoned. Blu reads that list and tells you what they had in common.
- Click any drop-off bar and land on the exact users who abandonedNo more staring at percentages wondering who left. Every bar is a link to a real list of people you can act on.
- Blu explains the pattern in plain languageThese 1,847 users dropped off before completing their profile. Here is why, and here is the journey to re-engage them.
 Trial-to-activation gap is your biggest leak. 38% drop-off after signup.
Know which cohorts keep coming back.
- Cohort retention curves and weekly heatmaps built on your real event dataControl the anchor event and the return behavior that matters for your model. Spot the cliff, then fix it from the same screen.
- Control the anchor event and the return behavior that mattersDefine retention on your terms: first session, feature activation, purchase. The cohort heatmap builds itself.
- Blu identifies the cohort at risk with specific contextWhen a cohort underperforms, Blu compares it against prior cohorts and tells you exactly what changed.
| Cohort | W0 | W1 | W2 | W4 | W8 | W12 |
|---|---|---|---|---|---|---|
| Jan | 100% | 64% | 52% | 44% | 38% | 34% |
| Feb | 100% | 61% | 49% | 42% | 36% | 32% |
| Mar | 100% | 67% | 55% | 47% | 41% | 37% |
| Apr | 100% | 59% | 47% | 39% | 34% | 30% |
| May | 100% | 63% | 51% | 43% | 37% | – |
| Jun | 100% | 60% | – | – | – | – |
Mar cohort retains 37% at W12, up 5pts. Week 1 is the stabilization point.Blu reads your reports and tells you why.
- Plain-language explanations for every metric movement in your reportsDriver breakdowns showing which segment, channel, or device caused the change. No more hunting through dimensions.
- Driver breakdowns showing which segment, channel, or device caused the changeBlu ranks the contributors so you see at a glance whether the drop was concentrated in one channel or spread across several.
- Blu recommends the next step with a ready-to-launch actionLaunch a win-back flow for the 623 users who dropped at step 2. Here is the draft. One click to activate.
Top drivers
Built for the outcomes that matter.
Five analytics use cases teams run on Intempt.
Connect every trusted source.
Plug into the tools your team already runs on.
Your customer data stays yours, and stays secure.
FAQ
Frequently asked questions
Everything you need to know about Intempt AI reports.
An AI reporting tool is an analytics platform that uses artificial intelligence to show you not just what happened in your data but also why it happened and what to do next. Intempt's AI report generator analyzes your funnel drop-offs, retention curves, and metric movements in plain language.
The best funnel analysis tool for finding drop-offs is one that connects the percentage to the actual people. Intempt lets you build any funnel in seconds, see conversion rates at every step, and click any drop-off bar to land on the exact users who left.
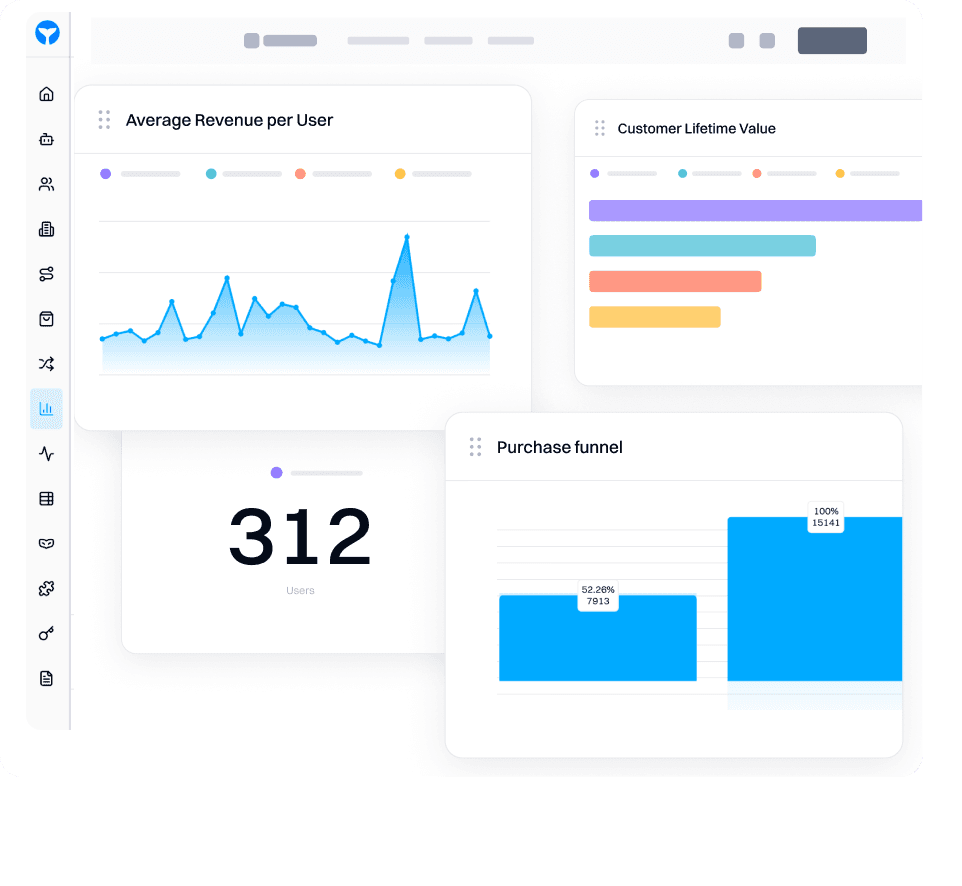
Intempt includes funnel reports with step-by-step drop-off analysis, cohort retention curves and heatmaps, performance metrics dashboards, and insight reports for event counts and active user trends. All reports update in real time from the same event stream.
You pick a sequence of events and Intempt shows conversion rates between each step, time-to-convert, and drop-off percentages. You can filter every funnel by segment, channel, device, UTM source, geography, or any custom attribute.
Intempt gives you cohort-based retention with weekly curves and heatmaps. You control the anchor event and the return condition that matters for your model. Pre-built retention templates include Weekly Active Users, Feature Adoption, and Account Re-engagement.
No. Every report in Intempt is built with a drag-and-drop interface. Filters, breakdowns, date ranges, and cohort comparisons are all point-and-click. If you want a custom analysis, you can ask Blu in plain language and it will run the query for you.
Build your first funnel report in seconds.
Pick your events, and your funnel renders live. Click any drop-off bar to see the actual users. Blu explains what they had in common and what to do next.