Analytics dashboards that explain themselves.
Pre-built dashboards for traffic, revenue, activation, and retention. Real data the moment you connect. No setup, no SQL.

“We were losing visitors before they signed up. Intempt's personalized experiences changed that - we started meeting people where they were instead of guessing. Once they're in, Intempt's automated email takes over and keeps the relationship moving. Acquisition and retention finally feel like one connected motion instead of two separate problems.”

Jim Stromberg
CEO, StockInvest
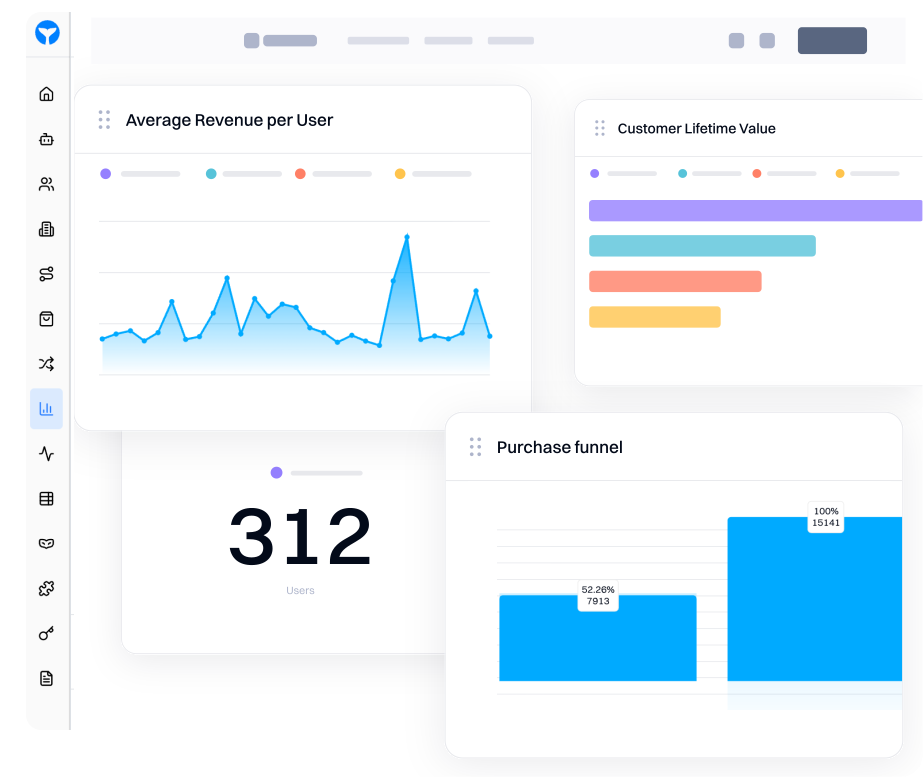
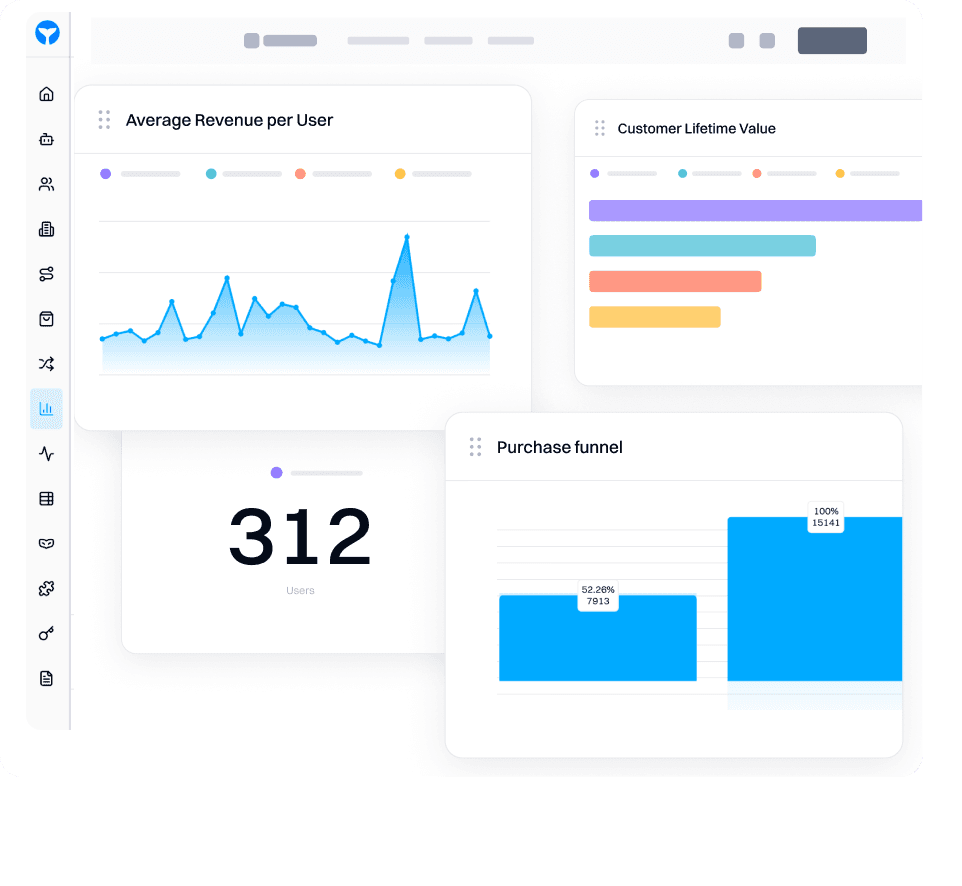
Four live dashboards, ready from day one.
- Traffic, revenue, and engagement out of the box, no setup requiredEvery data visualization compares this period against the last one automatically. Blu flags what changed with an explanation in plain language.
- Four pre-built dashboards covering Acquisition, Activation, Revenue, and RetentionYour real data populates each one the moment you paste the snippet. Nothing to configure, no event mapping, no SQL.
- Blu flags what changed in plain languageWhen sign-ups drop or a channel spikes, Blu surfaces the change, explains what drove it, and recommends the next step.
All four dashboards populated the moment you connected
Revenue is up 8.7% with no change in churn. Activation improved 3.2 points. Retention dipped slightly — Blu is monitoring the W4 cohort.
48,291
Sessions this month
68.4%
Activation rate
$94,210
MRR this month
81.2%
30-day retention
Every metric links to the users behind it.
- One click from any metric to the exact users behind itNo SQL query, no analyst needed, and no waiting for a report. Click a drop-off bar and land directly on the list of people who left.
- No SQL query, no analyst needed, and no waiting for a reportEvery data point is connected to the real people behind it. You can segment and act on any group from the same screen.
- Blu recommends the next action based on the patternWhen Blu reads the user list behind a metric drop, it tells you what those users had in common and what to do about it.
Checkout conversion dropped 2.1% this week
412 users reached checkout and did not convert. 68% were on iOS. Click any metric to see the exact users behind it.
Sessions
48,291
+12%
Sign-ups
3,214
+4%
Checkout
1,024
-18%
Revenue
$94K
+2%
| User | Last action | Device | Segment |
|---|---|---|---|
| user_8291 | Viewed checkout x3, left at payment | iOS | Trial |
| contact_4412 | Added to cart, abandoned at shipping | Android | Trial |
| visitor_7723 | Viewed pricing, no signup | Desktop | Anonymous |
| user_5503 | Started checkout, session expired | iOS | Trial |
| contact_3318 | Loaded checkout, closed tab immediately | Mobile | Paid |
One live view for your whole team.
- Shared dashboards that update live for every viewer at the same timeRole-based permissions so the right people see the right data. Marketing, sales, and product each work from the same source of truth.
- Role-based permissions so the right people see the right dataMarketing sees campaign performance. Sales sees pipeline. Product sees activation. One platform. One data set.
- Blu writes the weekly summary for you automaticallyInstead of spending Monday morning building a report, Blu tells you what moved this week and why in one message.
Good afternoon, Sid
Journey engagement rates outperforming channel averages
Running with average 44.5% open rate & 9.5% CTR, 5.7% of revenue from email only. Outstanding survey performing 84% & 88% completion. Welcome survey delivering 31%. Drop of 11% is noted.
Let's get you started — 3/3 steps
Create your first email using our templates or from scratch
Import your subscriber list to start sending
Send emails from your own domain to improve deliverability
$129,571.50
Total revenue ⓘ
↑ 1.5% vs previous month
$62,336.85
Attributed revenue ⓘ
↑ 0.9% vs previous month
| Name | Status | Revenue | Opens | Clicks | ARR | Reach |
|---|---|---|---|---|---|---|
Product launch EmailPush | Active | $2.30 | $52.34 | $45.06 | 2.31 | 700 |
Welcome Series Email | Active | $0.00 | $1.00 | $90 | 1.96 | 193 |
Built for the outcomes that matter.
Five analytics use cases teams run on Intempt.
Connect every trusted source.
Plug into the tools your team already runs on.
Your customer data stays yours, and stays secure.
FAQ
Frequently asked questions
Everything you need to know about Intempt analytics dashboards.
Analytics dashboards are real-time displays that aggregate your key metrics and business intelligence in one place. Intempt's analytics dashboards cover traffic, revenue, activation, and retention out of the box. They update in real time as events stream in, require no setup to get started, and include Blu, which explains what each change means and recommends what to do next.
An analytics tool with pre-built dashboards comes with ready-made views for traffic, revenue, and engagement that are useful from day one, without any manual configuration or event mapping. Intempt ships pre-built dashboards that go live the moment you connect a source. No SQL, no setup, and no waiting.
No. Paste the snippet and Intempt auto-captures page views, clicks, form submissions, and scroll depth out of the box. Your analytics dashboards have real data in them before you finish setup. You can define custom events later when you need more specificity.
Tools like Google Analytics and Power BI show you what happened in aggregate. Intempt uses machine learning to show you who did it and why. You can click any metric and land directly on the users behind it, and Blu explains the trend in plain language and tells you what to do next.
That was the whole reason we built it to be user friendly. Marketers, founders, and customer success teams use Intempt analytics dashboards every day without writing a line of code. If you can read a number, you can use the dashboard. If you want to go deeper, Blu handles the complex data analysis.
Real time. Every dashboard updates as events stream in. There is no batch processing, no overnight refresh, and no delay between a user taking an action and you seeing it reflected in your metrics.
Your dashboards go live the moment you connect.
Paste one snippet. Intempt ships four pre-built dashboards for traffic, revenue, activation, and retention. Real data. No setup. No SQL.