Connect every campaign dollar to revenue.
Multi-touch attribution across every campaign. See which spend produces customers who stay and which burns budget with no return.

“We were losing visitors before they signed up. Intempt's personalized experiences changed that - we started meeting people where they were instead of guessing. Once they're in, Intempt's automated email takes over and keeps the relationship moving. Acquisition and retention finally feel like one connected motion instead of two separate problems.”

Jim Stromberg
CEO, StockInvest
Know which campaigns actually drive revenue.
- Multi-touch attribution tracking every campaign touchpoint across channelsFirst-touch, last-touch, linear attribution, and time-decay models available in one report from the same underlying data.
- First-touch, last-touch, linear, and time-decay models in one reportSwitch between models without rebuilding your reports. See how credit shifts across each model.
- Blu identifies the gap between last-click and multi-touch realityYour last-click report credits paid search for 60% of conversions. The actual multi-touch data shows LinkedIn initiated 44% of those journeys.
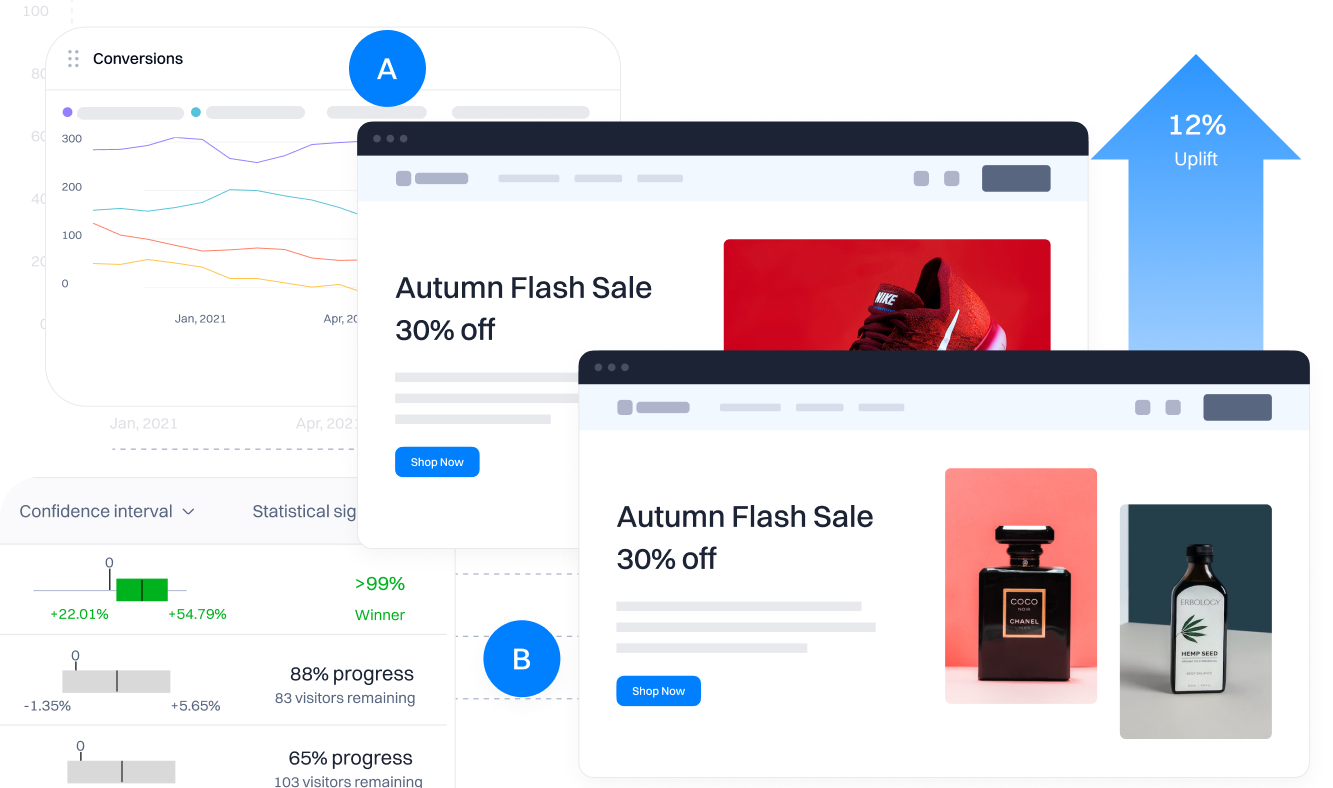
Experimentation program showing strong ROI
Running 12 active experiments with 4 showing statistical significance. Shipped experiments contributed an estimated +$34K/month in incremental revenue.
$139,142.86
Total revenue
↑ 1.5% vs. previous period
$48,700.00
Intempt Attributed Revenue (35.00%)
↑ 0.9% vs. previous period
| Name | Status | Duration | Type | Created by | Last updated ↓ | |
|---|---|---|---|---|---|---|
Homepage Hero A/B Test 95% CICUPEDSequential TestingBenjamini-Hochberg | Active | 13 days | Experiment | SJSarah Johnson | Jun 11, 2025 |
Know which spend produces the most revenue.
- CAC, payback period, and LTV calculated per campaign using your billing dataAd spend connected to Stripe or Shopify so revenue appears alongside cost in the same report. No manual spreadsheet reconciliation.
- Ad spend connected to Stripe or Shopify so revenue appears alongside costThe number that matters is revenue per dollar spent across the full sales cycle, calculated at the LTV level.
- Blu flags inefficiency with specific numbersYour highest-spend campaign has a 14-month payback period. Your lowest-spend campaign pays back in 6 weeks. Here is what to do.
Conversational Metrics
Based on 89 meetings with transcripts
Talk/Listen Ratio ⓘ
💬48% / 52%
↗ +2.5%
vs previous 30 days
Avg Questions ⓘ
❓17.0
↗ +0.2%
vs previous 30 days
Longest Monologue ⓘ
📈1m 44s
↗ +4.8%
vs previous 30 days
Filter Words ⓘ
🔇6.0%
↘ -4.7%
vs previous 30 days
Silence Duration ⓘ
🤫10.3%
↗ +5.3%
vs previous 30 days
Sentiment Breakdown ⓘ
💬29% / 10% / 61%
↗ +1.7%
vs previous 30 days
Conversations ⓘ
Number of conversations by project member
Conversations
Time spent in conversations ⓘ
Total conversation time by project member
Hours
Topic Insights
Blu tells you which budget shifts will win.
- Plain-language budget recommendations based on multi-touch revenue dataChannel comparison that weights LTV and retention quality, not just first conversion volume.
- Channel comparison that weights LTV and retention quality, not just conversionA campaign that drives high trial volume but churns in 60 days looks very different when you see the LTV data.
- Blu tells you exactly where to move budget and whyPause TikTok. Increase LinkedIn by $3K. Based on 90-day LTV, LinkedIn returns $4.20 per dollar versus $0.80 for TikTok.
SETUP & STATUS
Ship Video Ads Creative
Significant lift on 5/7 metrics, including the primary metric: +9.8%. Shipping to 100% of traffic projects a +9.8% lift. Estimated ~2,100 additional purchases/month.
Significant lift on 5/7 metrics including the primary metric
Net revenue impact estimated at +$12.4K/month if shipped
Statistical significance achieved (p < 0.001) on primary metric
Primary Metrics
Connect every trusted source.
Plug into the tools your team already runs on.
Your customer data stays yours, and stays secure.
FAQ
Frequently asked questions
Everything you need to know about marketing attribution.
Marketing attribution software tracks which marketing channels, campaigns, and touchpoints contributed to a customer conversion and assigns credit to each one. Unlike last-click tracking, true marketing attribution software follows the full customer journey from first awareness through purchase.
The best multi-touch option connects ad platform spend, behavioral data, and actual billing revenue in a single view without requiring a data engineer. Intempt tracks the full customer journey across every campaign and connects campaign performance directly to Stripe or Shopify revenue.
A multi-touch attribution model (MTA) distributes revenue credit across multiple touchpoints a customer interacted with before converting, rather than the single-point view that click attribution provides. Intempt supports first-touch, last-touch, linear, and time-decay attribution models.
Intempt connects your ad platforms (Google, Facebook, LinkedIn) to your billing system (Stripe or Shopify) by tracking the full customer journey from the first campaign touchpoint through to the paid transaction.
Yes. Intempt calculates 30-day, 90-day, and lifetime LTV by acquisition campaign using your actual billing data. A campaign that drives high trial volume but produces customers who churn in 60 days looks very different when you see the LTV data.
Google Analytics attribution shows last-click or first-click credit for sessions and pageviews. It does not connect to your billing system, does not calculate LTV by campaign, and does not track cross-device customer journeys over weeks and months.
Know which campaigns drive revenue, not just clicks.
Connect your ad platforms and billing system. Intempt tracks the full multi-touch journey and tells you exactly where to move budget based on actual revenue data.